- MarketMunch
- Posts
- How this trader just made $18,845.58 🤑
How this trader just made $18,845.58 🤑
PLUS: What the heck happened on Friday? 📉
Pip Munch
January 08, 2024
Happy Monday, Lark Traders. This is Lark Digest, the trading newsletter that makes you look forward to Monday morning.
We’ve got some good things on the agenda for you today:
How this trader made $18,000 🤑
What the heck happened on Friday? 😵
Let’s start off with some easy nibbles before getting into the main course.
WHAT WOULD YOU DO WITH $18,000? 😏
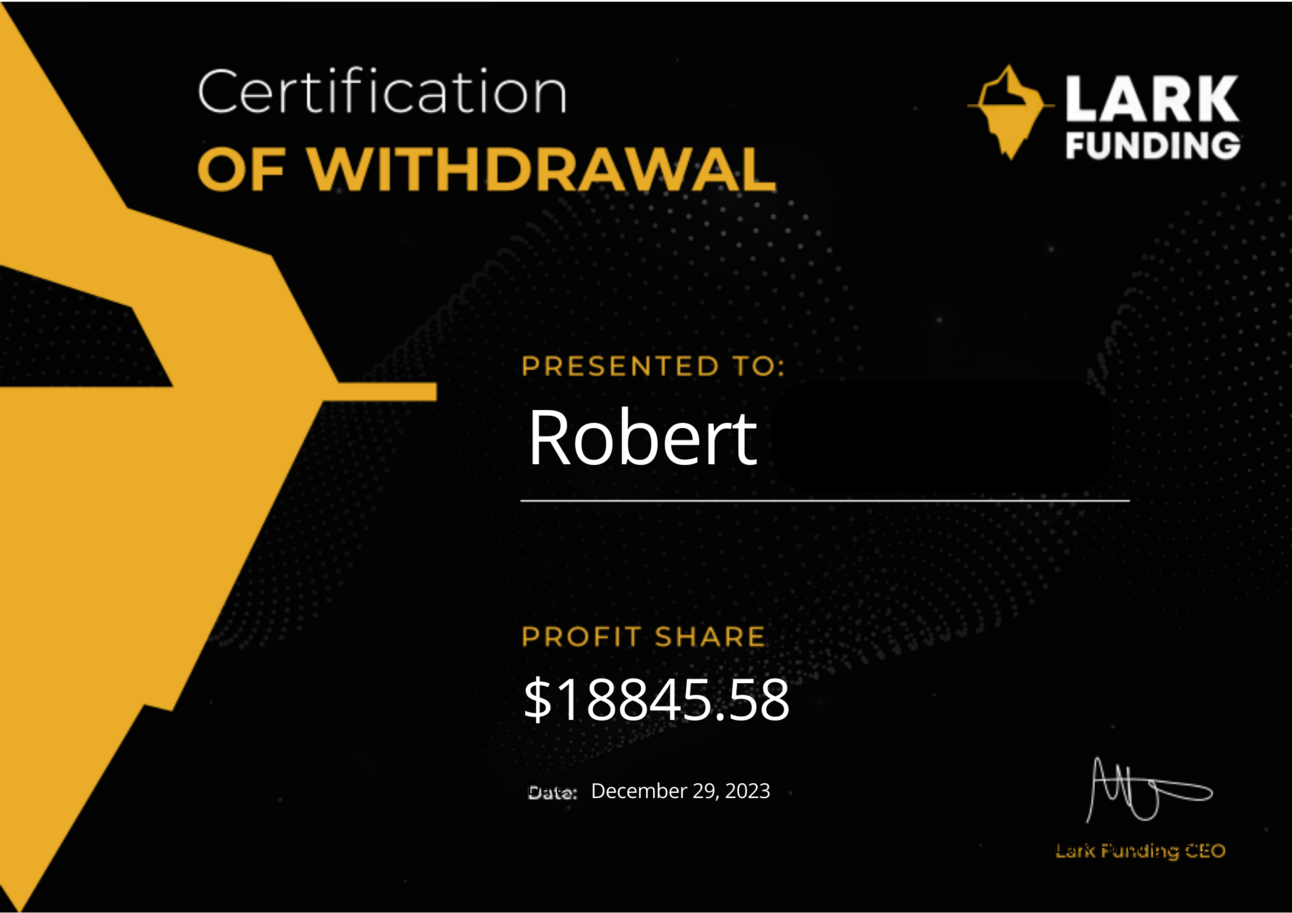
Well, this is exactly what a Funded Lark Trader had to ask themselves over the weekend. That’s right, last week, we processed our largest-ever payout of $18,845.58.
So, how did this trader do it? Unlike your guru, who will tell you it’s from visualization and dropping out of college, let’s see what the data actually shows.
Account Size = $200,000
Active Trading Days = 21
Average Winning Trade = $8,270.13
Average Losing Trade = -$4,116.13
Win Rate = 40.91%
Trades Taken = 22
Markets Traded = Only XAUUSD
What are the main takeaways?
1/ WIN RATE ISN’T EVERYTHING
Swallowing a loss can often feel like you’re taking the cinnamon challenge, but Robert shows us that it’s all a part of the game.
Robert’s stats remind us that there’s an inverse correlation between your win rate and your risk-to-reward.
This is important to understand:
The better your risk-to-reward, the worse your win rate is going to be. Whereas if you win a lot more trades than you lose, those wins are going to be smaller.
You need to pick which one you want and which one you can handle.
2/ THERE’S MONEY IN MASTERY
We see a lot of traders try and trade every pair out there. If it’s moving, it’s tempting to try and jump into a trade. But Robert shows us that there’s money to be made through mastery.
He only traded XAUUSD.
Imagine if you traded only one pair. Imagine how well you would learn that pair. How well you’d understand how it moves.
Something to consider…
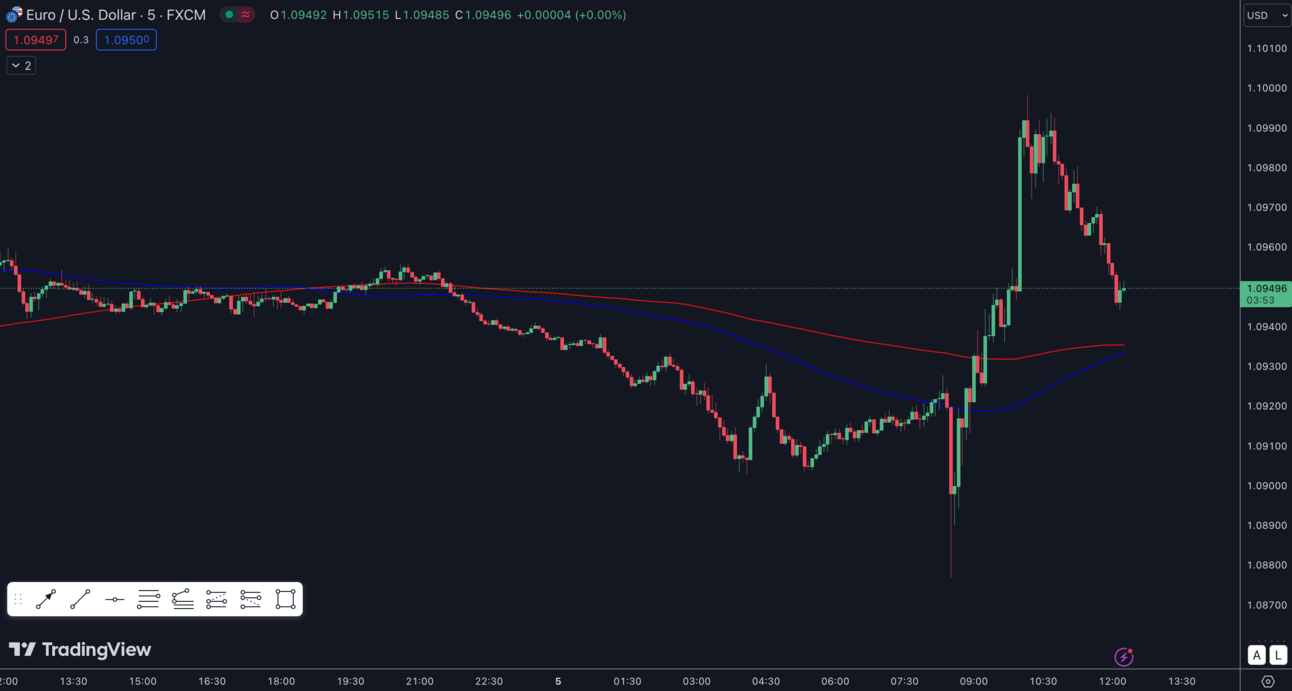
FRIDAY’S MARKET CRASH 📉
Last Friday, the market was more bipolar than your high school girlfriend (sorry, female readers).
After the market got an inside look into the jobs numbers and what Papa Powell and his buddies were thinking back in December, the USD had a big rally.
Until it completely reversed…
Like a good Chinese buffet, everything was going great until you needed to start digesting. And the market had a hard time digesting some of the headlines.
This is what you need to know:
Who’s got a job?
The report nobody is talking about.
Are lower rates coming?
1/ FROM GOOD TO BAD
The market initially rallied when everybody was reminded that they still had a job. That’s right, the unemployment rate was expected to go from 3.7% to 3.8%, but it didn’t move.
But because of a lesser-known report known as the ISM Report, the good vibes didn’t last long.
The ISM report is like the kid in high school you don’t pay attention to until you need him to help you with your math homework. AKA you only start to pay attention when things get ugly, and ugly they got.
It’s very simple:
The report gives us an insight into the performance of the non-manufacturing part of the economy like services, construction, agriculture, etc.
A reading above 50 means things are good. It means the economy is expanding. A reading below 50, though, means things aren’t good.
And on Friday, a reading of 50.7 was expected (slight growth).
What did we get?
43.3 😬
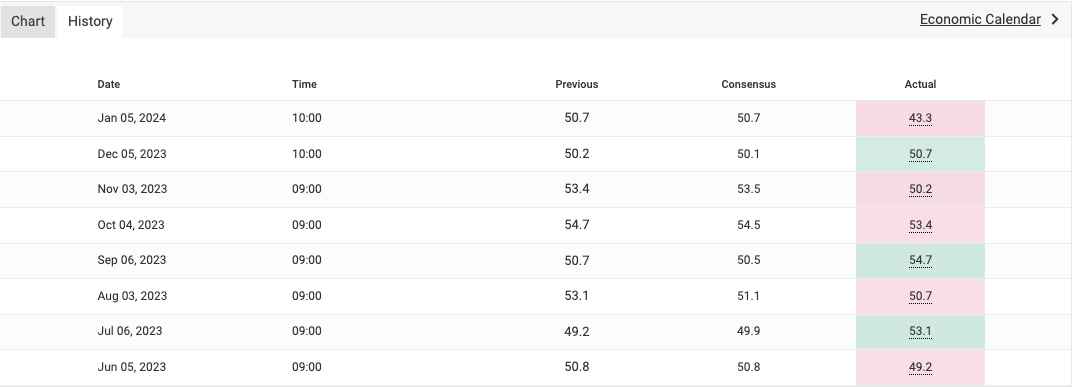
Yeah, not great.
It means the economy is beginning to contract (no bueno). But what’s even worse is that it’s a leading indicator of the health of the economy while NFP is lagging.
But that’s not all. Like any great infomercial, there’s more.
If you only read the headline news, you would have missed something major.
10 of the past 11 months of unemployment data were revised lower.
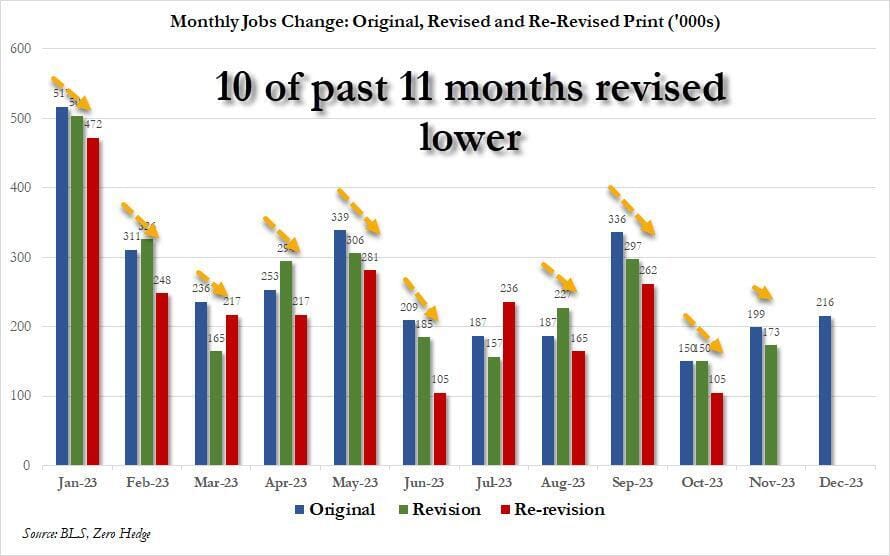
Yeah, Bidenomics isn’t looking so great.

2/ LOWER INFLATION RISK = LOWER RATES? 🤷♂️
Here’s the headline: everybody who’s been keeping a close eye on their grocery bill lately might start to feel some relief.
Why?
Quick recap:
Inflation has been out of control for the last few years. To bring it down, the Fed went on the fastest rate hiking cycle in history.
Okay, you’re caught up.
So, on Friday, we got a peek at the Fed’s minutes from December, and it looks like their rate hikes are finally starting to work.
So, does the story end there? Is it a happy ending?
Well, not quite…
They’re now starting to worry about the impacts of “overly restrictive policy.”
If rates stay high for too long, it could hurt the economy. People will be spending more on their mortgage payments and less at Chipotle, and that’s not what Powell wants.
So, if at this point you’re as lost as when I tried to watch Interstellar, you’re not alone. All of this uncertainty is what led to the wild market swings on Friday.
At Lark, we predict that rates will be much lower this time next year, and the market is thinking the same. The market now sees a 50% chance of a rate cut in March.
But if you’re stressed, don’t worry. It looks like Yellen is cooler than the current weather here in Montreal 🇨🇦 🥶
Yellen says US 'soft landing' underway, low inflation, wage growth to spur confidence reut.rs/4aKIh8k
— Reuters (@Reuters)
5:50 PM • Jan 5, 2024
So, if you’re just as confused as we are, remember your market correlations:
Higher Rates = Stronger USD, Lower Stocks 📉
Lower Rates = Weaker USD, Higher Stocks 📈
We’ll see you Wednesday,
Matt
PS: If you’re ready to become a Funded Lark Trader, these two promos are still active.

We’ve never had 30% off before.

Only $29? Yup.
RATE TODAY’S EDITION
What do you think of today's edition? |